from xapi_analysis.input_json import *
from xapi_analysis.input_csv import *xapi_analysis
A small library for data analysis of xAPI statements
This library provides the functions necessary to import and process xAPI statements, whether they are provided as JSON or csv files.
The documentation of the library provides tests and examples for the function, and it can be used as the starting point for analysing xAPI statements datasets.
Install
pip install git+https://github.com/stocastico/xapi_analysis.gitHow to use
After installing, import the modules in your Python code using the following calls
And from there you can use all the functions defined there.
Example
As an example, let’s just open a toy dataset of xAPI statements and run some functions on it
csv_file = '../example_statements_4.csv'
statements = import_csv(csv_file, index_col=0, delimiter=',')
statements.head(5)| timestamp | stored | actor | verb | object | result | |
|---|---|---|---|---|---|---|
| 0 | 2023-03-10 11:45:09.638000+00:00 | 2023-03-10T11:45:09.638Z | Teacher | Logged In | Salesianos | NaN |
| 1 | 2023-03-10 11:52:00.020000+00:00 | 2023-03-10T11:52:00.020Z | PC006 | Logged In | Salesianos | NaN |
| 2 | 2023-03-10 11:52:04.063000+00:00 | 2023-03-10T11:52:04.063Z | PC008 | Logged In | Salesianos | NaN |
| 3 | 2023-03-10 11:52:05.177000+00:00 | 2023-03-10T11:52:05.177Z | Tablet1 | Logged In | Salesianos | {"score":{"raw":0}} |
| 4 | 2023-03-10 11:52:05.679000+00:00 | 2023-03-10T11:52:05.679Z | PC004 | Logged In | Salesianos | NaN |
Process and filter the data:
statements = remove_whitespaces(statements, ["actor"])
statements = to_lowercase(statements, ["actor"])
statements = remove_verbs(statements, ["Logged In", "Logged Out"])
statements = remove_actors(statements, ["android3"])
statements.head(5)| timestamp | stored | actor | verb | object | result | |
|---|---|---|---|---|---|---|
| 14 | 2023-03-10 11:52:18.277000+00:00 | 2023-03-10T11:52:18.277Z | iphone1 | Placed | Earth | {"score":{"raw":0}} |
| 15 | 2023-03-10 11:52:18.847000+00:00 | 2023-03-10T11:52:18.847Z | iphone1 | Swiped | Left | {"score":{"raw":0}} |
| 18 | 2023-03-10 11:52:29.001000+00:00 | 2023-03-10T11:52:29.001Z | iphone1 | Placed | Earth | {"score":{"raw":0}} |
| 19 | 2023-03-10 11:52:29.094000+00:00 | 2023-03-10T11:52:29.094Z | android2 | Placed | Earth | {"score":{"raw":0}} |
| 20 | 2023-03-10 11:52:29.194000+00:00 | 2023-03-10T11:52:29.194Z | iphone1 | Swiped | Right | {"score":{"raw":0}} |
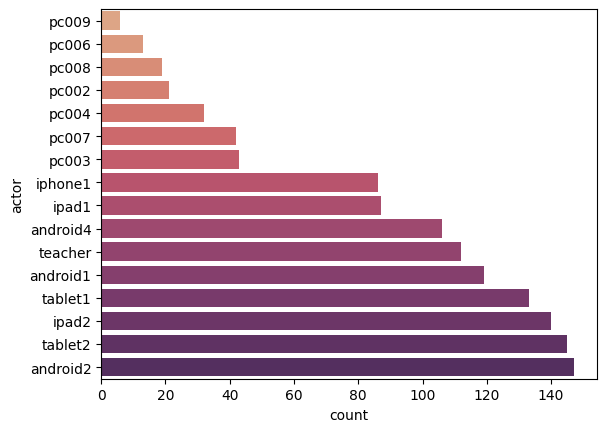
Count the number of statements sent by each actor
interactions =  count_interactions(statements)
interactions| actor | count | |
|---|---|---|
| 0 | pc009 | 6 |
| 1 | pc006 | 13 |
| 2 | pc008 | 19 |
| 3 | pc002 | 21 |
| 4 | pc004 | 32 |
| 5 | pc007 | 42 |
| 6 | pc003 | 43 |
| 7 | iphone1 | 86 |
| 8 | ipad1 | 87 |
| 9 | android4 | 106 |
| 10 | teacher | 112 |
| 11 | android1 | 119 |
| 12 | tablet1 | 133 |
| 13 | ipad2 | 140 |
| 14 | tablet2 | 145 |
| 15 | android2 | 147 |
create_barplot(interactions, 'count', 'actor', cmap='flare')